Mandelbrot set
The Mandelbrot set and its complex beauty.
 |
| Credit: Wolfgang Beyer |
# Formula
At its simplest, the Mandelbrot set is defined iteratively by the following formula:`z_(n+1) = (z_n)^2 + c`
# Generation
The rules for generating the Mandelbrot set are surprisingly simple; we begin by defining the following three constants:- `W` = the width of the plane
- `H` = the height of the plane
- `Z` = the zoom factor
Then for each value of `x={1,2,...,W}` and `y={1,2,...,H}`, we create a complex number `c` as following:
`c = (2x - W) / (W*Z) + ((2y - H) / (H*Z))i`
The value of `c` is then assigned to a new variable, called `z_1`, as:
`z_1 = c`
Then we define a new constant, called `I`, which represents the total number of iterations that we want to perform (usually, in the range `[30,150]`).
`I = 100`
Then we choose a limit `L`, which will stop the iteration early if a certain value `|z_n|` (where `1 <= n <= I`) exceeds the value of `L`.
`L = 2`
Now we can begin the iteration, with `n={1,2,...,I}`.
`z_(n+1) = (z_n)^2 + c`
At each iteration, `|z_n|` must be less than `L`. When this condition is not met, we stop the iteration early, as the sequence seems to diverge.
In the generation of the Mandelbrot set image, the pixels are usually colored according to how rapidly the sequence diverges; the color black is used for points where the sequence does not diverge (i.e. the value of `|z_I|` remained within `[0, L]`).
To determine how rapidly the sequence diverges, we use the last value of `n`, at which the iteration stopped or finished.
This value is given by:
`v = (I-n)/I`
In the end, we convert the HSV color to RGB, using a corresponding algorithm, then we set the current pixel `(x,y)` to this color.
`z_(n+1) = (z_n)^f(c)`
where `f(c)` is a specific function that maps the value of `c` to some other value.
For example, if we define `f(c)` as:
`f(c) = 1/c`
and set the specific values:
we get this surprisingly beautiful fractal:
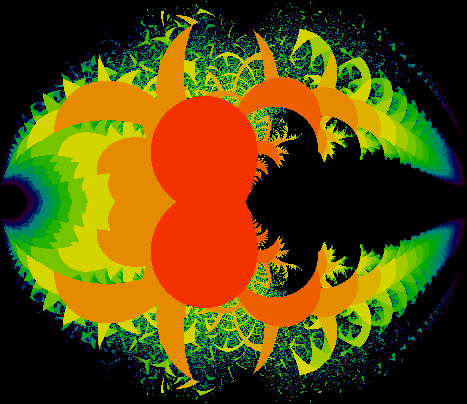

# Mandelbrot-like sets
An interesting class of Mandelbrot-like sets, is given by:`z_(n+1) = (z_n)^f(c)`
where `f(c)` is a specific function that maps the value of `c` to some other value.
For example, if we define `f(c)` as:
`f(c) = 1/c`
and set the specific values:
`Z = 1`
`I = 30`
`L = 100`
we get this surprisingly beautiful fractal:
Another example, defining `f(c)` as:
`f(c) = coth^(-1)(c^2)`
with the specific values:
`Z = 0.8`
`I = 30`
`L = 50`
produces this interesting fractal-pattern:
# More images
A collection of Mandelbrot-like fractal images can be found bellow.
Mandelbrot-like fractals:
Fractals from trigonometric functions:
Bonus:
# Implementation
Bellow we have two implementations in the Julia language. First program generates the standard Mandelbrot set, while the second is a customization of the first, and generates a Mandelbrot-like set.
Mandelbrot set:
Mandelbrot-like set:
Feel free to play with the code and try to discover new formulas that produce interestingly beautiful fractals, as there are (infinitely) many of them undiscovered.
Comments
Post a Comment